2025/01/28
Skip to content
e-Services

Figures and Charts on Red Tides in Hong Kong

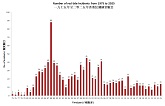
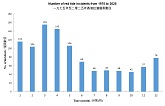
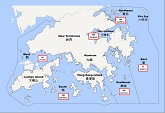
Figures and Charts on Red Tides in Hong Kong

Number of red tide incidents in Hong Kong from 1975-2024 (Figure 1)

Seasonal distribution of red tide incidents in Hong Kong from 1975-2024 (Figure 2)

Regional distribution of red tide in Hong Kong from 1975-2024 (Figure 3)


This link will open in a new windowNumber of red tide incident in Hong Kong from 1975-2024 (Figure 1)
  (Figure 1)
This link will open in a new windowSeasonal distribution of red tide in Hong Kong from 1975-2024 (Figure 2)
 (Figure 2)
This link will open in a new windowRegional distribution of red tide in Hong Kong from 1975-2024 (Figure 3)
 (Figure 3)


Back  Back to Top